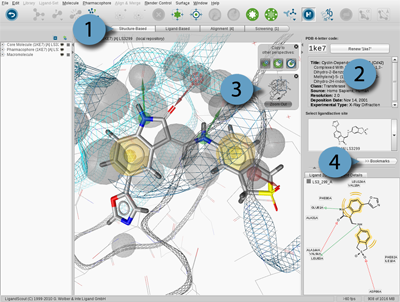
Another important use covered by the
Structure-Based Modeling Perspective is investigating small-molecule libraries. This can be done
either with or without a particular binding site as context by using the
Library View
.
The
PDB Panel
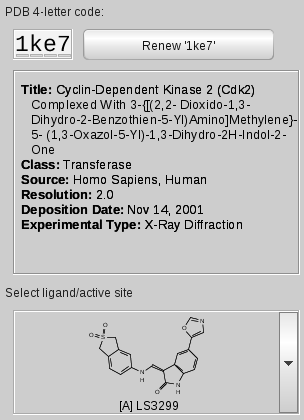
displays important information on the current macromolecule-ligand
complex, provides instant PDB access and is composed of three components:
LigandScout uses a "two-level" file storing strategy, the
Local and Shared Repository
.
If a PDB code is entered in the
PDB 4-letter code field
of the PDB Panel, LigandScout tries to find the associated files in
the Local Repository, the first stage. If unsuccessful, LigandScout
will check the Shared Repository which represents the second level.
Title, class, source, resolution, deposition date,
and the experimental type of the current PDB complex are provided in a
separate text box.
The
Ligand Active Site Selector
allows instant access to the active sites of the current complex.
Simply click the drop-down menu and select a ligand to zoom into the
respective active site. If you are already in an
Active Site View
the view will be switched without an animation.
3D View Depiction Modes and the Zoom Out Widget
LigandScout's
3D View
provides two distinctive macromolecule-ligand complex depiction
modes in the Structure-Based Modeling Perspective. Startup sets the display to
Macromolecule View
. LigandScout memorizes views and
positions. Thus, if you change from
Active Site View
to
Macromolecule View
using the
Zoom Out Widget
you will get your previous view setup of the current display.
The visibility of the
Zoom Out Widget
can be toggled
in the menu
>
.
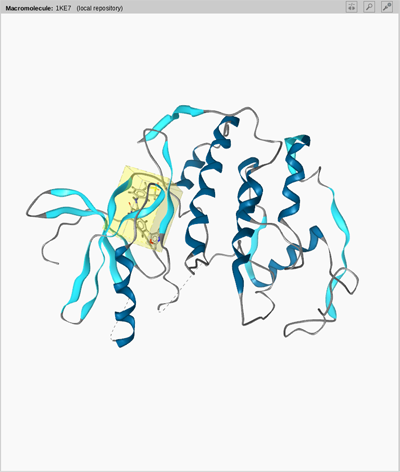
The
Macromolecule View
illustrates the global
structure and current orientation of the
macromolecule. You can switch to the active site by a
LEFT
mouse click
on the active site (blue box). To change back to the
Macromolecule View
just click on
Zoom out
button of the
Zoom Widget
. The
Zoom Widget
can be placed individually within the
3D View
.
The
Macromolecule View
provides structural
information on the macromolecule and the
ligand's position within it. This view gives you a clearly arranged
overview on the current PDB complex. Alpha-helices are shown in dark
blue, beta-sheets in light blue, and double helices in
brownish-orange. Consecutive amino acids which could not be
categorized are shown in gray. If some amino acids or nucleic acids
are missing, a gray dashed line will be shown.
Use your mouse to navigate within the
3D View
.
A single click on
Center Ligand and Environment
in the toolbar lets you return instantly to the
Macromolecule View
starting position.
In
Macromolecule View
, four different
rendering modes of both macromolecule and ligand are
available. Use the
submenu of the
menu or the
Change Render Style of Selected Atoms
icon to change between
Line
,
Ball
and Stick
,
Stick
and
Spacefilling/CPK
ligand rendering mode.
Similarly the rendering mode of the macromolecule is
changed with the
submenu
of the
menu
or the
Toggle Hydrogen
button. LigandScout supports
Lines
,
Splines
,
Snake
and
Ribbon
styles.
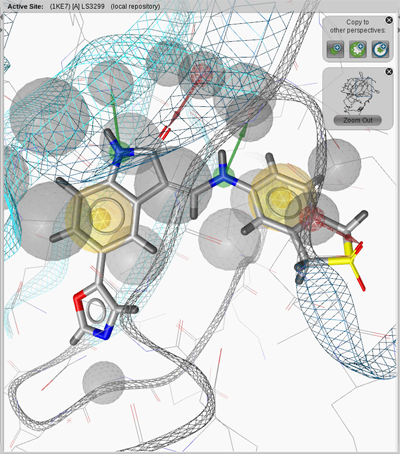
The
Active Site View
displays structural information of the ligand and its essential
surrounding macromolecular environment in detail. LigandScout
displays only amino acids or nucleic acids surrounding the ligand
while suppressing moieties irrelevant for macromolecule-ligand
interaction. The respective cutoff value is defined in the
Preferences/Structure-Based Modeling Settings as
Interaction Cutoff Threshold
.
You can easily switch from
Macromolecule View
to
Active Site View
by selecting a ligand in the
Ligand Active Site Selector
(
PDB Panel
) or by selecting
a yellow cube surrounding the ligand in the
3D View
. Use the
Center Ligand Molecule
icon in the toolbar to recenter the ligand.
Center Ligand and Environment
button lets you recenter the current active site. A click on the
Zoom out
button of the
Zoom Out Widget
in the 3D View lets you return to the starting position
in the
Macromolecule View
.
Rendering Options of the Active Site View
The
Active Site View
provides additional
rendering options as available in
Macromolecule View
.
The additional render options are found in the
Render Control menu
.
Ligand Rendering Settings: Ligand Default Style Submenu
Toggle on/off hydrogen depiction with the
Show/Don't Show Hydrogens
radio buttons or the
Toggle Hydrogen
icon.
Show Hydrogens Stubs
reduces the size
of hydrogens to stubs.
Show Templates
activates the depiction of default geometric templates depending on
the hybdridization-state of the currently selected atom.
Show Interactions
displays all possible
interactions of the currently selected atom.
Show Ionic
Interactions
displays ionic interactions between metals
and non-metals. The
Pickable
check box sets the
ligand selectable/unselectable.
Environment Rendering Settings: Environment Default Style Submenu
The
rendering submenu
corresponds in large part to the respective ligand menu and lets
you select different rendering modes and define hydrogen handling.
The
option activates the
depiction of default geometric templates depending on the
hybdridization-state of the currently selected atom. The
Pickable
check box sets all of the atoms in the
environment as selectable/unselectable.
Selection Rendering Settings: Selection Submenu
The
submenu lets you customize
the rendering of the current selection. LigandScout provides four
different modes:
Line
,
Ball and
Stick
,
Stick
and
Spacefilling/CPK
.
Pharmacophore Rendering Settings: Pharmacophore Submenu
The Structure-Based Modeling Perspective of LigandScout allows you to visualize GRID maps directly in the
protein binding site. To import GRID maps into the binding site, select
in the menu
>
. LigandScout will
ask you for the kind of GRID probe to be visualized.
The GRID maps are especially useful for the investigation of LigandScout
pharmacophores. These maps provide information on the importance
and intensity of certain protein-ligand interactions and may help
you to discriminate between crucial pharmacophore features and
constraints that are less important. Pharmacophoric features located
in areas that indicate strong molecular interactions by GRID
analysis (using compatible probes of course) are likely to be
highly relevant for the binding of the ligand to the protein.
Since GRID maps do contain absolute coordinates, you need
to load the appropriate binding site in order to have the GRID map correctly
aligned with the pocket. At best, load the particular binding the GRID map
has been calculated for.
The Bookmark View stores active sites of macromolecules. This has the advantage
that you can analyze the binding sites of interest one after the other without
the need of loading them through the PDB Panel. The active sites are managed in the
Bookmarks Panel.
The
Bookmarks Panel
allows you to access
your bookmarked active sites which are represented by the
Bookmark
icon. Bookmarks of the current
Active Site View
are stored using the
Copy current binding site to
icon located on
Copyboard Widget
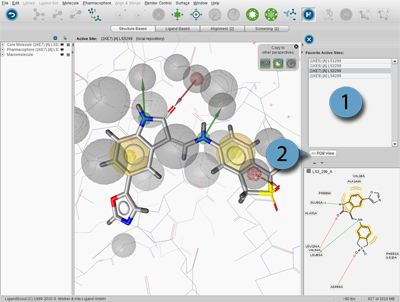
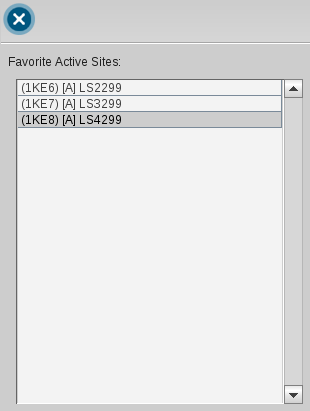
of the the Structure-Based Modeling Perspective. For instance, load 1ke6 into the
Structure-Based Modeling Perspective and zoom in. Add the active site to the Bookmark View by the
Copy current binding site to
.
Repeat this procedure for 1ke7 and 1ke8. To access a bookmarked active site simply click on its
name in the Bookmark List and the appropriate active site is shown in 3D View.
You can erase a certain bookmark entry by selecting it and
press the
Delete Bookmark
button.


