
Pharmacophore model creation strongly depends on the PDB complex when you choose
the Structure-Based Modeling method. If no structural data of the protein-ligand complex
is available or the complex lacks quality, then the Ligand-Based Modeling method is used.
LigandScout's Ligand-Based Modeling Perspective allows you to generate pharmacophores from a set of ligands that bind to
one target protein and provide similar biological activity (so called active ligands).
LigandScout provides techniques which help to prepare an active set by clustering,
include molecule flexibility by conformational analysis and an
efficient alignment algorithm to derive pharmacophore models from a ligand-set.
The Ligand-Based Modeling Perspective includes
Basic User Interface Modules
,
a Ligand-Set Table and Results Table.
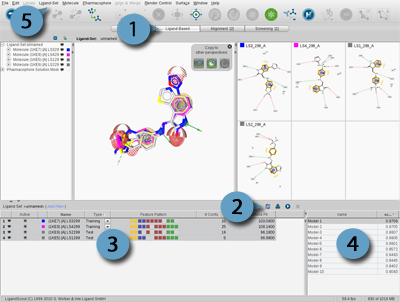
Figure 4.16. Ligand-Based Modeling Perspective (1), Tool bar (2), Ligand-Set Table (3),
Results Table (4) and Ligand-Set menu (5)
Ligand-based pharmacophore modeling requires a set of two or more input ligands to generate
characteristic pharmacophores. There are three different types of input ligands: Training-Set, Test-Set and
Ignored Ligands. The Training-Set molecules are used for the actual pharmacophore
creation and the Test-Set ligands are used to verify the resulting
pharmacophores. Ligands that should not be included in pharmacophore generation and testing can
be marked as Ignored Ligands.
The input ligands may be provided in three different ways:
You can
import
e.g. a ligand set file (*.lsd) or
add molecules to the existing Ligand-Set by selecting the
Add Molecules
submenu in the
Ligand-Set
menu and choose the type of set to be added. Another
alternative is to add your molecules by means of the
Copyboard Widget
to the Ligand-Based Modeling Perspective.
The navigation in the Ligand-Based Modeling Perspective is quite similar to the
Library View
, but with
a different focus. The Ligand-Set Table (after importing the ligands)
shows the list of molecules which serve as input for the pharmacophore
generation process. The user can change ligand properties (e.g. type, activity, etc.),
filter
the table content, and
select ligands to make them visible
in the 3D (only if 3D coordinates are present), 2D, and Hierarchy View. Like in the
Library View
,
navigating through available conformations is possible by using the
Alternatives Switcher
.
The ligands are colored differently to keep the overview.
The Training-Set ligands are colored randomly
and ligands from the Test-Set and Ignored Ligands are marked gray.
The color of the ligands can be changed in the
Hierarchy View
.
You can customize the type of a selected ligand by choosing the
appropriate type in the Ligand-Set Table or flag the ligand in the
Ligand-Set
menu. It is also possible to change
the activity of a ligand in this way.
In the Ligand-Set Table toolbar,
buttons are provided for the main tasks in
ligand-based pharmacophore modeling. From left to right: ligand conformations can be created by OMEGA
(
Generate Conformations for Ligand-Set
icon),
the available ligands can be clustered according to a multi-conformational alignment score
(
Clustering
icon),
and the automatic ligand-based pharmacophore creation
(
Run Ligand-Based Pharmacophore Creation
icon) can be started.
If conformations are already available, the pharmacophore generator uses them directly
for the pharmacophore creation, otherwise they are generated on the fly.
Conformer generation, clustering and pharmacophore creation can be customized as described
in
the section called “Ligand-Based Modeling Settings”
and
the section called “Alignment Settings”
.
When a ligand-based pharmacohore creation run is successful,
the Ligand-Set Table is automatically updated and provides additional information such as
feature patterns, number of conformations, and the Pharmacophore
Fit of the ligands matched with the selected result pharmacophore. The first digit
of the Pharmacohphore Fit score represents the number
of matched features and the second one, the RMSD value. The Feature Pattern of a ligand
illustrates the color-encoded features that were matched by the ligand. Thus you
can see at first glance the distribution of the features and
which of the resulting pharmacohores are matched best by
the Ligand-Set (frequency of matched features).
The Results Table is positioned at the right-bottom corner of the Ligand-Based Modeling Perspective.
After the ligand-based pharmacophore generation process has finished the results are
listed in this table including the name and score. By default, the entries are sorted by
score value in descending order, but the user can change both the sorting order and
sorting criteria by clicking the appropriate column identifier.
Each entry of the Results Table represents a valid pharmacophore model
(i.e. it consists of at least
three features) and stores the state of all Training-Set molecules (i.e. alignment pose and
active conformation). Selecting a resulting pharmacophore model updates the 3D View and 2D View to
show the particular pharmacophore and aligned Training-Set molecules.
Furthermore, score values and feature patterns in the Ligand-Set Table are updated for the currently selected
pharmacophore.
The range of the score values shown in the Results Table depends on the
scoring function used (see
Ligand-Based Modeling Settings
).
If you select the Pharmacophore Fit scoring function then the score value describes the
number of matched features and RMSD. All other scoring functions produce normalized values that range
from zero to one, where one is the optimum.
The generated ligand-based pharmacophores may be transfered into other perspectives,
where you can
export
them
in different file formats. Optionally, you can generate ligand-based pharmacophores by using the
command line
as well. For further information,
please see
Chapter 8,
Ligand-Based Pharmacophore Design
.
Ligand-based pharmacophore creation can be influenced
in two ways. The first one sets a user-defined pharmacophore model to the
starting point of the alignment procedure. The second directs the
generation procedure by customized feature definitions.
During the ligand-based pharmacophore modeling process,
ligands are ranked by their number of conformations. Then, starting from the ligand with
the lowest number of conformations, their pharmacophore models are aligned with the ones
of the second ranked ligand. Ligand-based pharmacophores will be composed from these
alignments and aligned with the pharmacophores of the next ranked ligand and so on. If
you set a user-defined pharmacophore in advance, this pharmacophore is kept as the first
pharmacophore to be aligned to the pharmacophores of the following ligand.
The advantage of this functionality is that the
features of the user-defined pharmacophore are more likely
to survive this procedure.
You can use this functionality by selecting in the menu
Ligand-Set
>
Set Pharmacophore Bias
and load a pharmacophore of your choice.
Alternatively, you can add a pharmacophore from another perspective to
the Ligand-Based Modeling Perspective using the
Copyboard Widget
.
Although, the first functionality stamps the ligand-based pharmacophore modeling
by a user-defined pharmacophore model, LigandScout allows you to provide additional customized feature definitions
in addition to LigandScout's standard feature definitions (built-in types). These chemical features will be
used temporarily for aligning the molecule, but will not be included
in the resulting 3D pharmacophore. You can access the custom feature
functionality directly in the
Ligand-Set
menu or via the settings
dialog after clicking the
Run Ligand-Based Pharmacophore Creation
button in the Ligand-Based Modeling Perspective.
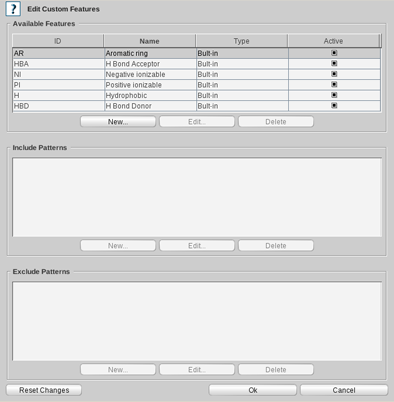
A custom feature is defined by several SMARTS patterns that specify the substructures where the feature shall
(or shall not) be placed. For the definition of a new custom feature click on the
New
button under the
available Features panel and specify an ID (abbreviation) and name for the feature. To enable/disable
the feature in the pharmacophore generation process click the
Active
check box in the feature table.
To define or include SMARTS patterns for a feature
click on the
New
button under the Include
Patterns List. Declare valid SMARTS patterns and specify tolerance
spheres for the feature. Smarts patterns that specify substructures
where the particular feature shall not be placed (exclude patterns)
are defined in the same way except that you do not need to specify a
tolerance.
If you want to make changes to your custom feature
definitions, you can edit them by clicking on the
Edit
button. To delete custom features as a whole or to delete only some
include/exclude patterns of a feature, select the desired features or
patterns and click on the appropriate
Delete
button.
To apply your changes click the
OK
button on the
bottom-right corner of the
Edit Custom Features
dialog.
To reset any of your changes click on the
Reset Changes
button.
Use the custom feature functionality when you want to put
emphasis on certain common substructures of the ligands in the alignment steps
performed during the pharmacophore generation process. Note that although the
custom features will be considered in the pharmacophore creation process
(if enabled) they are not visible in the resulting 3D pharmacophores.