
LigandScout
Screenshot Gallery
The screenshot images below demonstrate a part of the capabilities of LigandScout's graphical user interface. These include structure-based pharmacophore creation, editing, interpolating and overlaying pharmacophore models (with or without a macromolecule context), automatic ligand identification, enhanced hit-list analysis including dynamic pharmacophore alignment, and minimization featuring a state-of-the art MMFF94 implementation.
- Structure-based pharmacophore creation and editing
- Binding site visualization and analysis
- Screening result analysis and 3D pharmacophore scoring
Structure-based pharmacophore creation and editing
|
|
|
| Automatic ligand and binding site recognition |
Pharmacophore creation |
Alignment and pharmacophore editing |
![]()
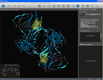
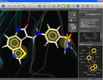
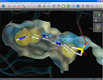
Structure-based pharmacophores can be created with only a few mouse clicks in LigandScout. A protein-ligand complex is loaded by typing the PDB code or by opening a PDB file. Ligands are automatically recognized and interpreted (left). A click on the ligand zooms into the binding site, where the ligand interpretation can be reviewed and easily corrected (e.g. a bond type is changed by selecting the bond and typing a number for the changed valence). After this, a pharmacophore model can be created from the complementary features between macromolecule and ligand by pressing (ctrl)-(f9) (center). Pharmacophores that were created in such a way and their corresponding ligands can be added to the alignment view with one single mouse click for further modeling (right).
Binding site visualization and analysis
|
|
|
| GRID map visualization | Binding site surface | Molecular surface |
![]()
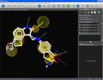
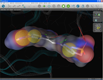
Several additional visualization possibilities allow a better understanding of the characteristics of the binding site. The first feature is to read ASCII '.kont' files generated with Molecular Discovery's program GRID (water map in blue, hydrophobic map in green). A special iso-contour surface is shown and the iso-value can be adjusted dynamically in real-time (left). Additional visualizations include the possibility to render state-of-the-art molecular surfaces either from the protein side (center) or for the bound ligand (right).
Screening result analysis and 3D pharmacophore scoring
|
|
|
| Hit list analysis in library view |
Docking result analysis | MMFF94 minimization in binding site |
![]()
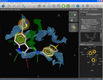
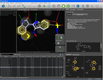
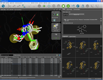
One of the key features of LigandScout is its ability to study libraries in the context of a binding site. You can dock molecules and load libraries or even hit lists from other programs and re-score them by several newly developed scoring functions. You can calculate binding affinity scores or interaction feature counts and dynamically align the molecules to the current pharmacophore as soon as they are shown. Hitlists from other screening tools (e.g. shape-based screening tools or pharmacophore screening tools from other vendors, but also docking results) can be loaded and scored using the currently shown pharmacophore. This can be done on the original coordinates or after alignment to the pharmacophore (left). The same functionality can be used to analyze docking results and find those poses, which match best to the pharmacophore that you created with LigandScout (center). Additionally, any molecule can be minimized in the binding site using the MMFF94 force field, whereas all compounds that are in the environment (typically the macromolecule and conserced water molecules) are kept rigid, and all compounds that are on the ligand side (e.g. the ligand and unconserved water molecules) are optimized (right).

|
Register and get LigandScout now! |